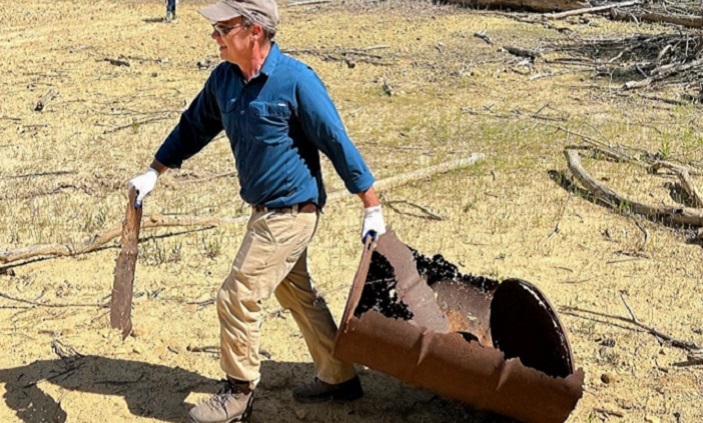
A study funded by the Tennessee Department of Transportation and Keep Tennessee Beautiful found that, over the last six years, there’s been a 12 percent drop in litter on state roadways.
[Above photo by Tennessee DOT]
The 2022 Tennessee Statewide Litter Study – conducted by engineering firm Burns & McDonnell as a “follow-up “ to similar litter studies in 2016 and 2006 – helps identify how litter has changed over time, the relationship between litter volume and roadside characteristics, and assess the impact of nearby infrastructure and socioeconomic factors.
The study’s methodology included the random selection of 120 roadway locations split equitably among the following four roadway classifications in both urban and rural areas of Tennessee: Interstate, U.S. highway, state highway, and local roads.
The “sampling plan” used by Burns & McDonnell for this study included the investigation of designated litter “hot spots” in the cities of Memphis, Nashville, Knoxville, and Chattanooga, as well as “at-risk” and “distressed locations” along other roadways statewide.
“The 2022 study is one of several research products that helps [us] evaluate progress on litter abatement and make the most effective use of future litter prevention and cleanup resources,” explained Denise Baker, Tennessee DOT transportation supervisor, in a statement.
“Overall, while encouraging that there has been a 12 percent reduction of litter on Tennessee roadways, there are still more than 88 million pieces of litter on public roads at any given time,” Baker said.
Some of the key findings from Tennessee’s 2022 litter study include:
- U.S. routes had the lowest amount of litter-per-mile, at 7,386 items of litter per mile.
- Local roads – which account for the most road miles (82,538 miles) in Tennessee – in aggregate had the highest percentage (80 percent) of total litter items by roadway type.
- Most of the litter on Tennessee roadways is smaller than four inches. An estimated 679.7 million pieces, or 88 percent, items of litter were four inches or smaller in size. However, there is still a significant quantity (88.5 million pieces or 12 percent) of larger, and often more visible, litter on Tennessee roadways.
- So called “intentional littering” increased by about 18 percent due, in part, to changes in product packaging and classification differences between the 2016 study and the 2022 study.
- Plastic and paper items compose most litter items, while the number of cigarette butts observed per site decreased for interstate and U.S. highway roadway classifications in 2022 versus the 2016 study.
- Motorists were determined to be the leading sources of litter on Tennessee roadways.
Other state departments of transportation have also conducted or participated in similar roadway litter studies.
For example, the Pennsylvania Department of Transportation is playing a key role in executing the state’s first ever ‘Litter Action Plan’ unveiled in November 2021; developed after a comprehensive study of roadway litter issues across Pennsylvania.
Subsequently, a group of employees from PennDOT and the Pennsylvania Department of Environmental Protection (DEP) received a Governor’s Awards for Excellence in recognition of their efforts to develop that Litter Action Plan.
PennDOT said it spends roughly $14 million each year on litter cleanup statewide, while DEP has funded “Pick Up Pennsylvania” community litter cleanups and illegal dump site cleanups for over two decades – supporting volunteers in removing many tons of trash from the land and waters.
The persistence of littering is what prompted PennDOT and DEP to collaborate with Keep Pennsylvania Beautiful to conduct the first comprehensive state study to inform development of the Litter Action Plan, with a focus on changing littering behavior.
 States
NCDOT to Rebuild I-40 with National Forest Rocks
June 27, 2025 States

