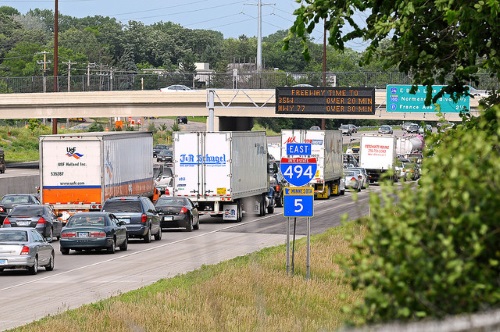
The latest research updates for an annual study overseen by the Accessibility Observatory at the University of Minnesota estimates the impact of traffic congestion on access to jobs indicates that Los Angeles, New York, and San Francisco are now the top three U.S. metropolitan areas for “loss in job accessibility” due to traffic congestion.
[Above photo by Minnesota DOT.]
The new rankings are part of the Access Across America study, which began in 2013 and is sponsored by the National Accessibility Evaluation Pooled-Fund Study, a multi-year effort led by the Minnesota Department of Transportation and supported by partners including the Federal Highway Administration and 11 additional state DOTs.
This year’s report – Access Across America: Auto 2017 – is based on data from 2017 and ranks access to jobs by car for the 50 largest U.S. metro areas. Cars, trucks, and other private motor vehicles are used for an estimated 86 percent of U.S. commuting trips, making it the most widely used commute mode.

The rankings focus on accessibility – a measure that examines both land use and transportation systems – and factors it against how many destinations, such as jobs, can be reached in a given time, explained Andrew Owen, director of the Observatory, in a statement.
“Rather than focusing on how congestion affects individual travelers, our approach quantifies the overall impact that congestion has on the potential for interaction within urban areas,” he said. “For example, the Minneapolis–St. Paul metro area ranked 7th in terms of job accessibility but 28th in the reduction in job access due to congestion. This suggests that job accessibility is influenced less by congestion here than in other cities.”
Owen added that key factors affecting the rankings for any metro area include the number of jobs available and where they are located, the road network structure, traffic management practices, the provision of alternate transportation modes, and population size, density, and location.

The Accessibility Observatory also conducts annual accessibility studies on transit systems and pedestrian travel. The group’s 2017 edition of Access Across America: Transit reports that 42 of the 49 largest metros showed increases in job accessibility by transit. Though rankings of the top 10 metro areas for job accessibility by transit only changed slightly from the previous year, new data comparing changes within each of the 49 largest U.S. metros over one year helped researchers identify the places with the greatest increases in access to jobs by transit.
Kansas City, for example, improved more than 17 percent while San Francisco, which ranks 2nd for job accessibility by transit, improved nearly 9 percent. In all, 42 of the 49 largest metros showed increases in job accessibility by transit.
The Accessibility Observatory’s pedestrian study, last conducted four years ago, examines the accessibility to jobs by walking in the 50 largest U.S. metropolitan areas, calculated by population size. Jobs reachable within ten minutes are weighted most heavily in the group’s pedestrian study, with decreasing weights awarded as travel times to jobs increases up to 60 minutes.
 Nation


