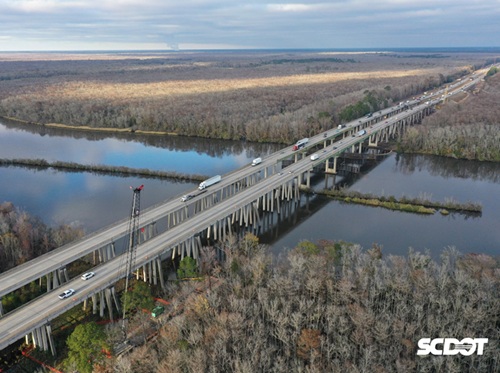
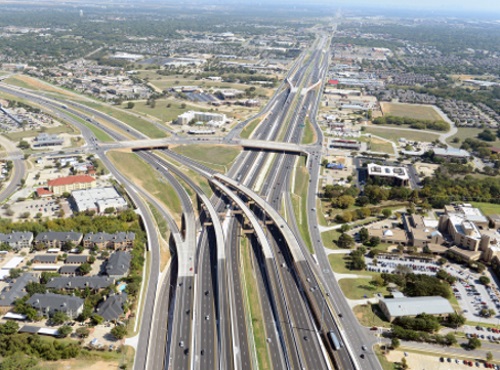
The COVID-19 pandemic “flattened” roadway congestion to levels not seen in 40 years, according to the 2021 Urban Mobility Report compiled by the Texas A&M Transportation Institute, yet that respite turned out to be short-lived.
[Above photo by the Texas DOT]
When the COVID-19 economic shutdown began in the spring of 2020, daily commuter traffic dropped by almost half compared to the year before, the report noted. Any traffic snarls that did exist ended up spread out over more hours of the day, as rush hour travelers took on roles as midday shoppers and child transporters.

In addition, more of each week’s travel delay in 2020 shifted to the weekend, another result of reduced weekday rush hour commuting, the report noted.
[Editor’s note: The Federal Highway Administration noted in March that, combined, all miles driven on public roads and highways in 2020 reached its lowest point since 2002.The agency added in a statement that the nationwide closures of businesses, schools and other economic factors related to COVID-19 “are thought to be key factors” in 2020’s estimated 430.2 billion VMT decrease.]
TTI’s report – funded by the Texas Department of Transportation and the National Institute for Congestion Reduction – also discovered that Americans experienced four distinct traffic years in one during 2020:
- In January and February, traffic looked a lot like 2019.
- However, in March through May, the COVID-19 shutdown produced roadway volumes not seen since the presidency of George H.W. Bush (1989 to 1993) back when postage stamps cost 25 cents (they cost 55 cents today).
- Rush hours began to reappear in June through August, reminding Americans of what traffic was like at the start of the 21st century.
- By September, traffic conditions and delays crept back toward “normal,” though only reminiscent of traffic conditions in 2005.
Even though the severity of the COVID-19 pandemic eased over the course of 2020, the “root causes” of traffic problems did not change at all, according to TTI’s research.

“The underlying elements of traffic problems – too many car trips, too much rush-hour roadwork, crashes, stalled vehicles and weather issues – have not receded,” noted Tim Lomax, one of the report’s authors, in a statement. “What’s different is that those elements have been eclipsed by plummeting traffic volume.”
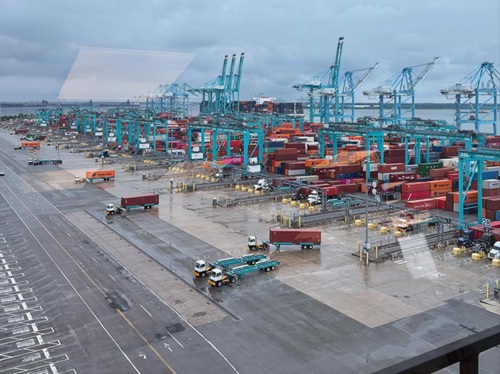
Truck traffic, on the other hand, hardly dropped at all during the year – a result of increased at-home delivery of items as everyday as cereal and toilet paper.
“The pandemic really impacted supply chains,” added report co-author Bill Eisele. “But through it all, truckers kept on delivering the goods in our time of need.” Suppliers accomplished that in part by shifting to more nighttime and early morning deliveries, he said.

“As the 2021 Urban Mobility Report shows, congestion levels in Texas and much of the rest of the country have rebounded to near pre-pandemic levels,” noted Marc Williams, the Texas DOT’s new executive director.
“In Texas, we continue to see the same underlying causes: a growing population and economy that is producing more passenger vehicle and truck traffic on roadways throughout the state,” he said.
“That’s why we’re focused on important initiatives such as Texas Clear Lanes to address the top chokepoints in our state’s largest metropolitan areas, as well as understanding the many facets of the traffic challenges we face,” Williams added.
Those challenges include dealing with a spike in roadway fatalities that occurred during the COVID-19 pandemic. According to preliminary estimates released June 3 by the National Highway Traffic Safety Administration, some 38,680 people died in motor vehicle traffic crashes in 2020: the largest projected number of fatalities since 2007, the agency said.

That spike in traffic fatalities also occurred despite a drop in vehicle miles traveled or VMT as preliminary data from the FHWA indicates VMT decreased by about 430.2 billion miles or 13.2 percent in 2020 compared to 2019.
That means, according to NHTSA, that the fatality rate for 2020 climbed to 1.37 fatalities per 100 million VMT, up from 1.11 fatalities per 100 million VMT in 2019.
Analysis conducted by the Governors Highway Safety Association in 2020 also highlighted a severe spike in speeding and other reckless driving behavior across the country in the midst of the COVID-19 pandemic.
State department of transportation also quickly noted such spikes occurring on their respective roadways in 2020 – engaging in a number of efforts as a result to reduce them, such as partnerships with state highway patrol agencies.
 Top Stories


